Scott Berkson
Last updated: 24 January 2026
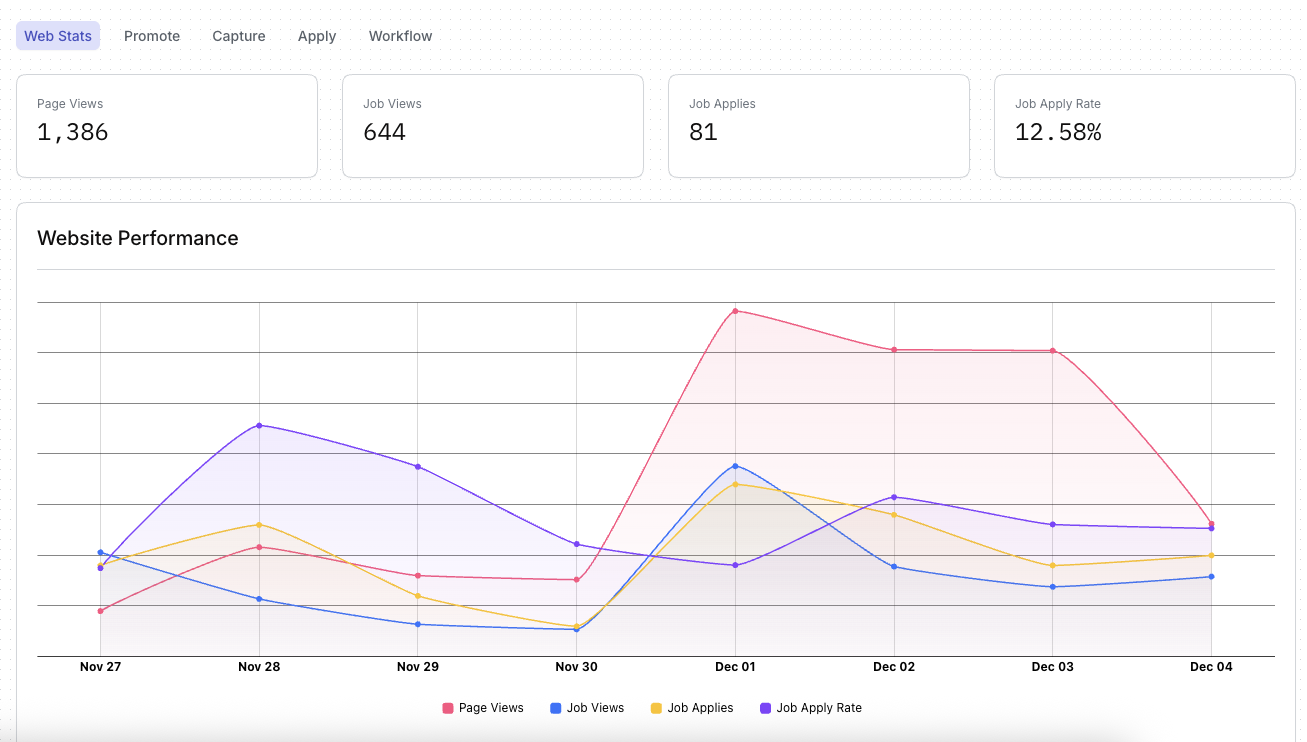
Boostie Website Performance gives your team a real-time pulse on how your digital talent funnel is performing. It pulls together the moments that matter - traffic, job engagement, and apply behavior - into one clean, modern workspace. In seconds, you can see what’s firing, what needs love, and where candidate momentum is building across your funnel.
Core Web Metrics
Page Views - Total visits hitting your career site not related to jobs.
Job Views - How often candidates open one of your jobs.
Job Applies - How many applies result from job views.
Apply Rate - How efficiently your views convert into applies.
Website Performance Trends
A multi-line performance graph that shows how all major metrics move over time. You’ll instantly spot:
Traffic spikes and slowdowns
Engagement lift or falloff
Conversion swings
Patterns connecting views to applies
Job Performance gives your team a real-time view into how individual job postings are performing across the top of your talent funnel. It highlights which roles are attracting attention, which ones are converting, and where optimization is needed.
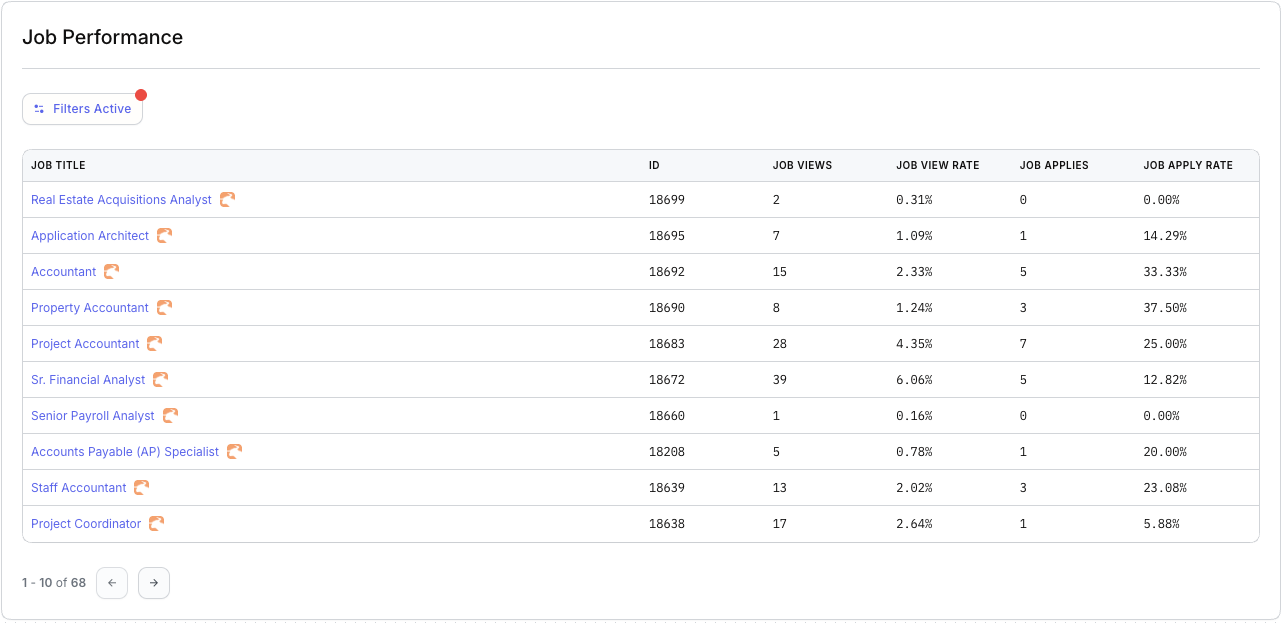
Each row represents a single job and displays five core performance indicators:
Job Title – The open position being tracked.
ID – Your internal job record identifier.
Job Views – How many times candidates viewed that job posting.
Job View Rate – The percentage of total site traffic that engaged with this specific job.
Job Applies – The number of applications for that role.
Job Apply Rate – The conversion rate from job views to job applications.
This table updates automatically as new candidate activity comes in.
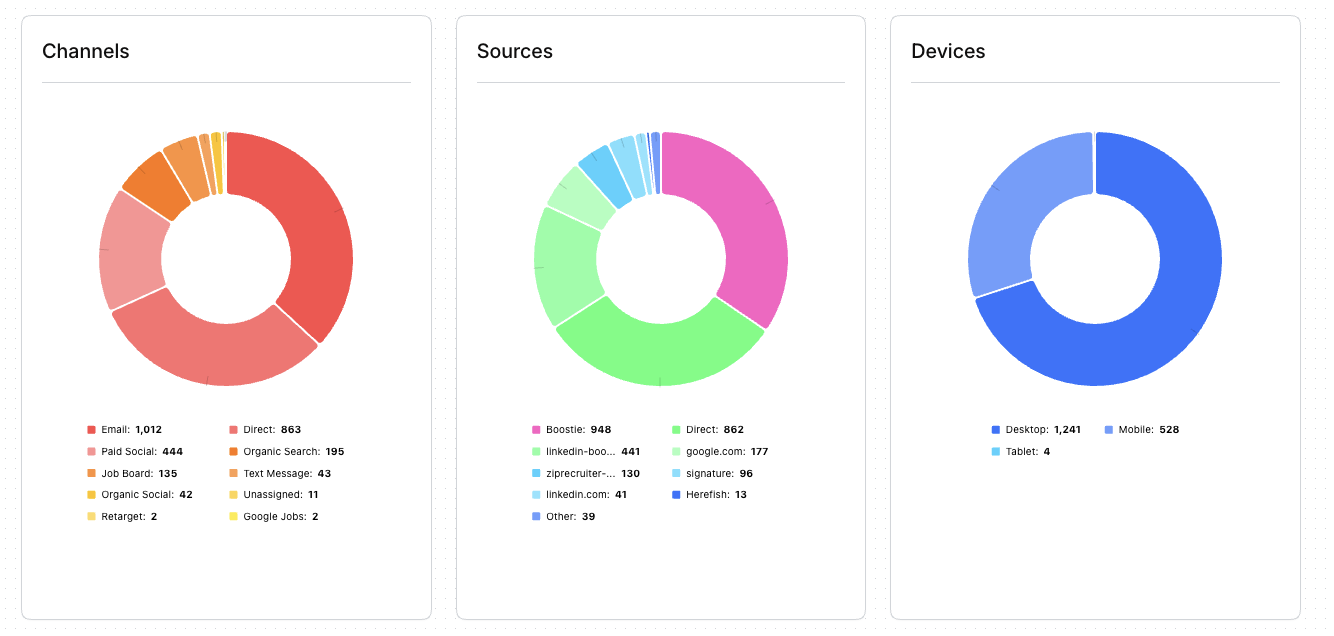
Boostie gives you a clear picture of where your candidate traffic is coming from and how people engage with your career site. These three attribution widgets - Channels, Sources, and Devices - help you understand what’s driving visibility, clicks, and apply behavior across your digital talent funnel.
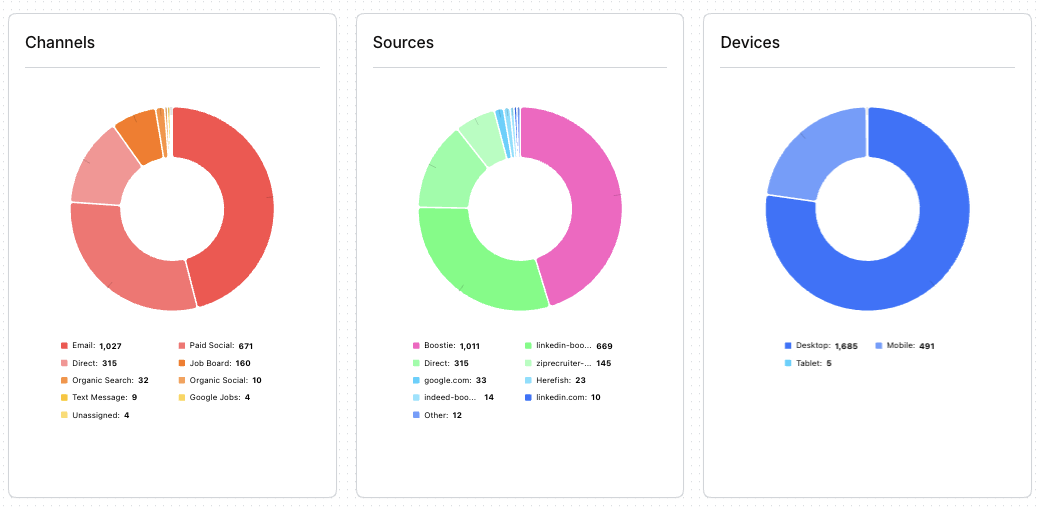
Channels show how candidates are reaching your site or job content. This view helps you understand which outreach methods are performing best.
Key highlights from the example above:
Email and Direct traffic are the strongest drivers, showing high engagement with your outbound communication and bookmarked/typed-in visits.
Paid Social and Organic Search contribute additional visibility from active job seekers.
Job Boards, Text Messages, and Organic Social play supporting roles in your overall funnel.
This breakdown helps you decide where to double down (high-performing channels) and where optimization may be needed.
Sources show the exact origin of traffic - specific platforms, referrers, or campaigns that led candidates to your jobs.
Key insights from the example above:
Boostie-driven content is a major contributor, validating the strength of your automated outbound campaigns.
Direct sources remain consistently strong.
LinkedIn, ZipRecruiter, Google, and email signature traffic all add meaningful volume to top-of-funnel activity.
Smaller referrers (Herefish, Other) round out long-tail passive visibility.
This view helps teams evaluate the relative performance of platforms and understand where their brand has the most reach.
Devices show how candidates are viewing your content - whether they’re on mobile, desktop, or tablet.
From the example data above:
Desktop leads, indicating candidates are often researching roles while at a computer.
Mobile traffic is still significant, reflecting on-the-go browsing and the importance of mobile-friendly job pages.
Tablet usage is minimal but still present.
Why This Matters for Staffing & Recruiting and TA Teams
These three attribution insights work together to help you:
Understand which marketing efforts actually drive candidate engagement
Optimize your job distribution, social strategy, and email outreach
Improve candidate experience by tailoring content to the devices they use
Make smarter decisions about budget, messaging, and funnel strategy
Boostie turns attribution data into actionable guidance so your team can continuously strengthen top-of-funnel performance and informs decisions on UX, job content layout, and apply-flow optimization.
Boostie Campaign is your tool for putting open roles in front of the right talent - whether they’re actively looking or passively browsing. With just a few clicks, you can launch multi-channel ad campaigns (display ads, Google Search, retargeting) that drive quality traffic directly to your career site - not third-party job boards.
Reach “intent-driven” candidates searching on Google and other search engines.
Retarget people who visited your career site before (but didn’t apply), keeping your brand and open roles in front of them.
Use smart, AI-driven ad generation and landing page creation - so you don’t need to be a marketing expert to run effective campaigns.
Take control of your funnel - attract talent to your site and ATS.
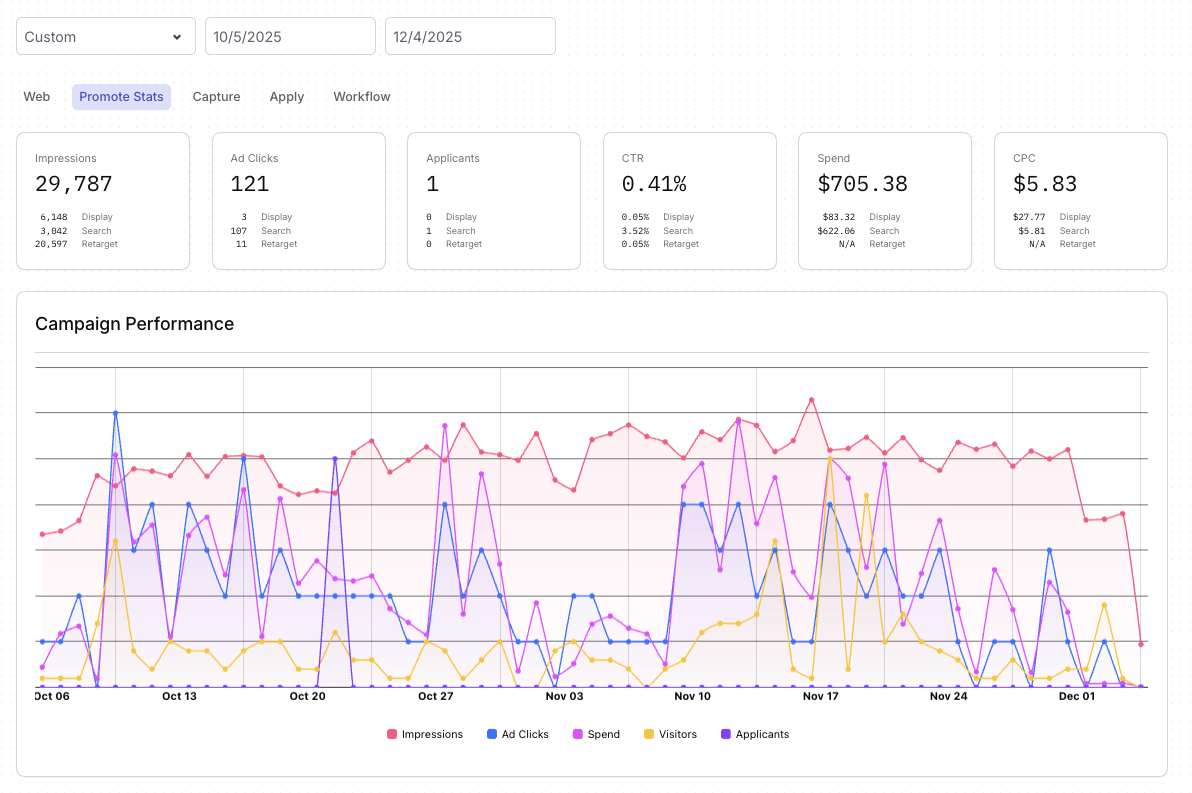
The Campaign Stats section gives your marketing team a clear picture of how your paid job promotion efforts are performing across ad channels. It brings together impressions, clicks, spend, and downstream engagement so you can understand the effectiveness of your campaigns at a glance.
Boostie’s Campaign Stats equip staffing and recruiting teams with the insight needed to:
Understand which channels drive the most meaningful engagement
Adjust budgets toward higher-performing campaigns
Identify early signs of drop-off or underperformance
Improve messaging, targeting, and applicant flow
It’s a centralized, easy-to-interpret view of your overall promotion health—so you can continuously optimize how you attract candidates.
The total number of times your ads were shown across display, search, and retargeting channels. Higher impressions indicate broader visibility for your jobs.
How many candidates engaged with your ads by clicking. This shows whether your messaging and targeting are compelling enough to spark interest.
The number of applications attributed to your campaigned traffic. This helps measure the quality of the audience your ads are attracting.
The percentage of impressions that resulted in a click. CTR reflects how effective your ads are at generating engagement.
Your total investment in promotion across all channels. Tracking spend helps ensure your budget is being used efficiently.
How much you’re paying, on average, for each ad click. This is a key measure of cost efficiency across different ad types.
The performance chart visualizes how impressions, clicks, spend, visitors, and applicants trend over time. This helps you quickly identify:
Traffic spikes or slow periods
Days where spend increased or decreased
How engagement correlates with visibility
Whether promotions are driving consistent candidate activity
This view gives marketing teams a simple way to diagnose performance and make data-informed decisions about future promotions.
Job Alerts are Boostie’s always-on engine for turning website visitors into long-term talent. Instead of losing candidates who aren’t ready to apply today, Job Alerts collect their information, build your subscriber base, and reconnects them with the right jobs at the right time. It transforms your career site from a passive listing page into a dynamic, candidate-generating funnel.
The Job Alerts Stats section of the dashboard shows how effectively you’re converting visitors into subscribers and applicants.
Job Alerts help staffing and recruiting and TA teams:
Build a growing pipeline of passive candidates.
Re-engage visitors who aren’t ready to apply on their first visit.
Match subscribers with relevant jobs automatically, generating additional applicants without added spend.
Understand which touch points are most effective at driving conversions.
Strengthen top-of-funnel health with continuous, automated talent attraction.
With Job Alerts, every visitor becomes an opportunity - and Boostie turns that opportunity into measurable recruiting impact.
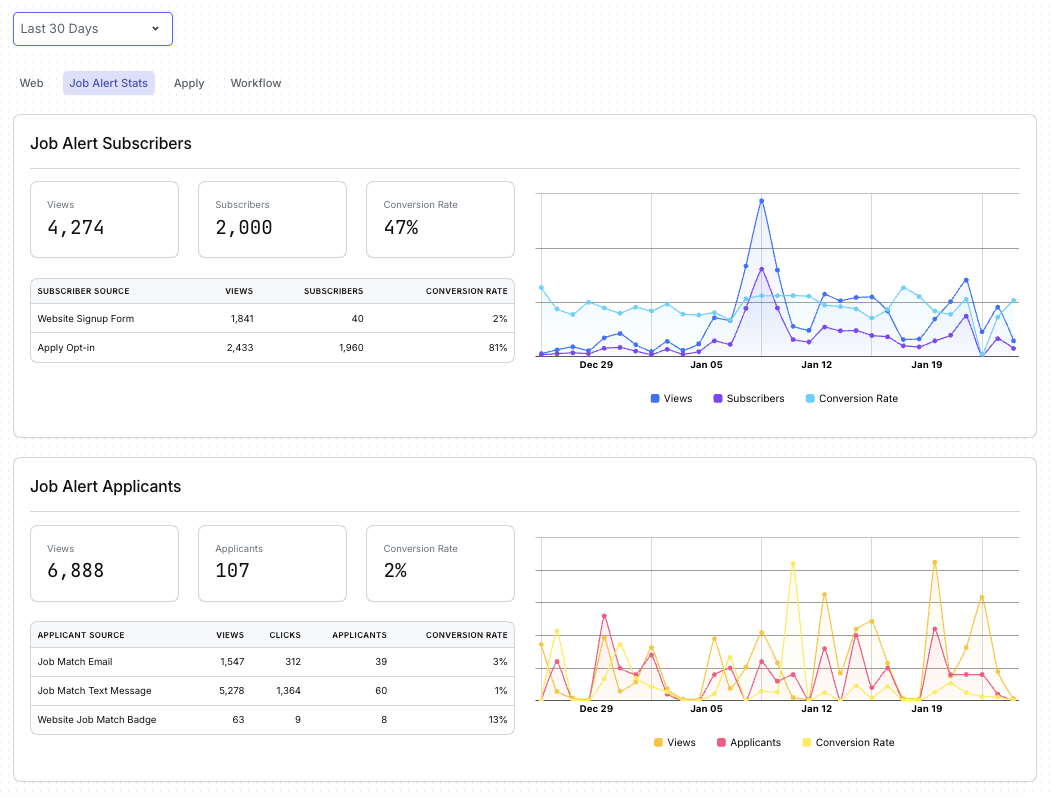
This view tracks how many people saw your subscription prompts (such as job alerts, signup forms, or opt-in messages) and how many chose to join your talent pool.
You’ll see:
Views: How often your opt-in prompts appeared to visitors.
Subscribers: The number of people who opted in to receive job alerts or updates.
Conversion Rate: How effectively your prompts turn visitors into subscribers.
A breakdown shows which methods (website form, apply opt-in, etc.) generate the most subscribers so you know where your strongest engagement is coming from.
A trend chart visualizes subscriber activity over time - letting you see patterns, spikes, and the impact of changes to your content or traffic.
This section highlights how many candidates moved from passive subscriber to active applicant through Boostie Match.
You’ll see:
Views: How often job-match recommendations were shown.
Applicants: How many candidates applied directly through email, text, or website job-match prompts.
Conversion Rate: How effectively your match recommendations drive real applications.
A detailed source table shows which channels - email, text messages, or job-match badges - are most successful at nudging subscribers into the apply flow.
A performance chart displays how views, applicants, and conversion rates fluctuate over time, helping you spot momentum or identify opportunities to refine your targeting.
The Traffic Attribution section helps you understand how candidates are finding your site, where they’re coming from, and what devices they use to engage with your jobs. These insights show which outreach efforts are working and how to optimize your top-of-funnel strategy.
Together, Channels, Sources, and Devices give recruiting and TA teams a full picture of candidate behavior at the very top of the hiring funnel. With this information, teams can:
Double down on the highest-performing marketing efforts
Strengthen underperforming traffic sources
Improve visibility where candidates already spend their time
Optimize job pages and apply flows based on how people are accessing them
Boostie turns complex attribution data into a simple, visual snapshot - helping you understand what’s working, what’s not, and where to focus next to increase candidate engagement.
Channels answer the question: “What marketing paths brought candidates to us?”
This view groups traffic into key categories such as (for example) email, paid social, job boards, organic search, text messaging, and direct visits.
It’s designed to help you quickly see:
Which outreach methods are driving the most visibility
Where your strongest engagement is happening
How diversified your traffic mix is
Whether specific channels may need more attention or improvement
By understanding which channels perform best, teams can shift effort and budget into the areas that consistently deliver candidate activity.
Sources go one level deeper and answer: “Which specific platforms or referrers are generating traffic?”
This shows the exact origin of candidate activity such as (for example) Boostie campaigns, LinkedIn, ZipRecruiter, Google, job boards, and other referral sources.
This breakdown helps you:
Identify the platforms sending the highest-quality traffic
Understand how much Boostie contributes to your funnel compared to external sources
Spot movement or opportunities across individual job board partners
Track long-tail referrers that quietly add value
It’s a powerful way to connect the dots between your marketing efforts and candidate behavior.
Devices show how candidates browse your content: desktop, mobile, or tablet.
This matters because device usage directly impacts:
How job pages should be formatted
How long visitors stay engaged
How easy the apply process feels
Which UX optimizations can improve conversions
If mobile (for example) makes up a large portion of your traffic, ensuring a seamless mobile apply flow becomes even more important.
Boostie Apply streamlines and optimizes the candidate application experience. Instead of long, outdated ATS forms, Apply gives candidates a fast, modern, mobile-friendly flow that reduces friction and dramatically increases completion rates.
The Apply Stats section of your dashboard shows how well your application process is performing - helping your team identify where candidates engage, where they drop off, and how strong those applicants appear to be.
By combining Boostie’s optimized apply flow with transparent analytics, the Apply overview helps your team:
Increase application completions through a frictionless candidate experience
Identify strong applicant pools faster with Fit Signal
See which channels and sources actually produce quality applicants
Understand and improve conversion steps within the apply funnel
Optimize for the devices candidates use most
Boostie Apply turns your application process into a high-converting, data-backed funnel that delivers more completed applications - and higher-quality ones - without adding complexity to your ATS.
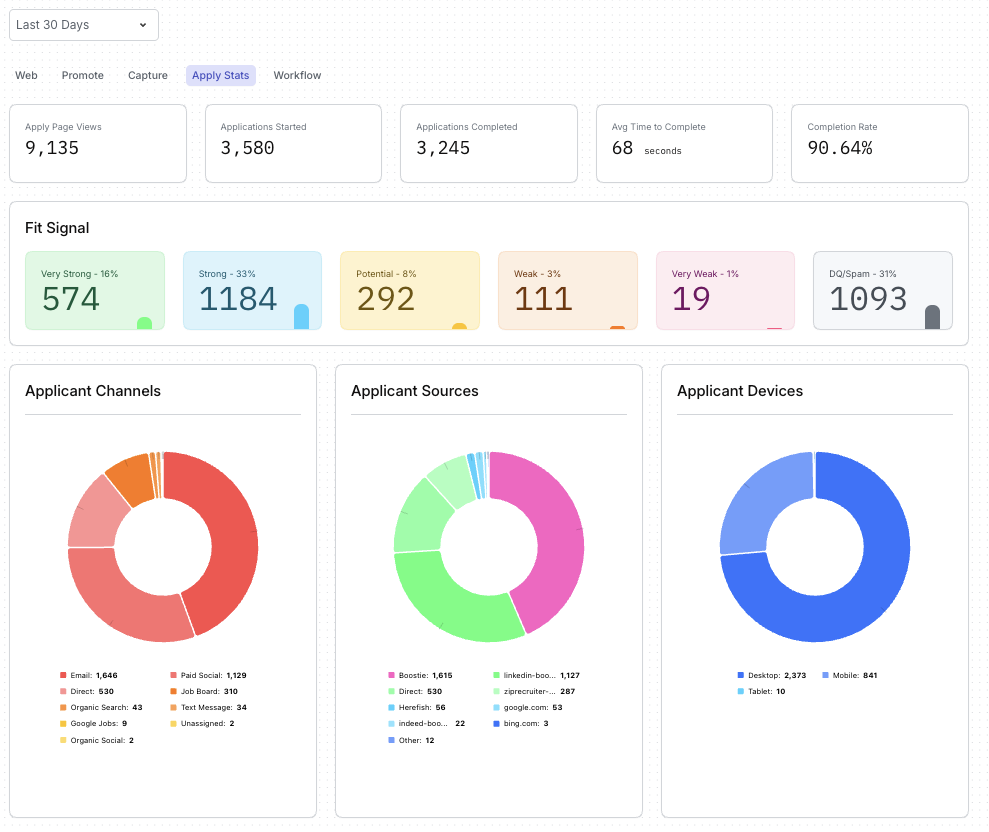
These top-line metrics give you a quick snapshot of how candidates move through your apply flow:
Apply Page Views - How many people landed on your job’s application page - an indicator of job interest and traffic health.
Applications Started - How many candidates began filling out your apply form.
Applications Completed - The number of candidates who finished the application - your most important conversion metric.
Average Time to Complete - How long it typically takes a candidate to finish the apply flow. A shorter time generally signals a smooth, user-friendly experience.
Completion Rate - The percentage of candidates who start and finish the application. High completion rates reflect the effectiveness of Boostie’s simplified apply experience.
Fit Signal gives your team immediate insight into the strength of your applicant pool by categorizing applicants into tiers:
Very Strong
Strong
Potential
Weak
Very Weak
DQ/Spam
This helps recruiters quickly prioritize candidates and understand the overall quality of traffic coming through Apply.
This breakdown shows how candidates discovered your job before applying - such as email outreach, paid social, job boards, organic search, text messaging, or direct visits.
Understanding channels helps you see which touch points most effectively drive real applicants (not just clicks or views).
Sources indicate the specific platforms or referrals that delivered applicants - such as Boostie’s automated campaigns, LinkedIn, job boards, Google, or other channels.
This view helps you:
Identify which platforms drive the highest-quality applicants
Compare Boostie-generated traffic against external sources
Optimize your distribution strategy
This section shows which devices candidates use to apply - desktop, mobile, or tablet.
This insight helps your team ensure that the apply experience remains smooth across all device types, especially mobile, where many job seekers begin their search.